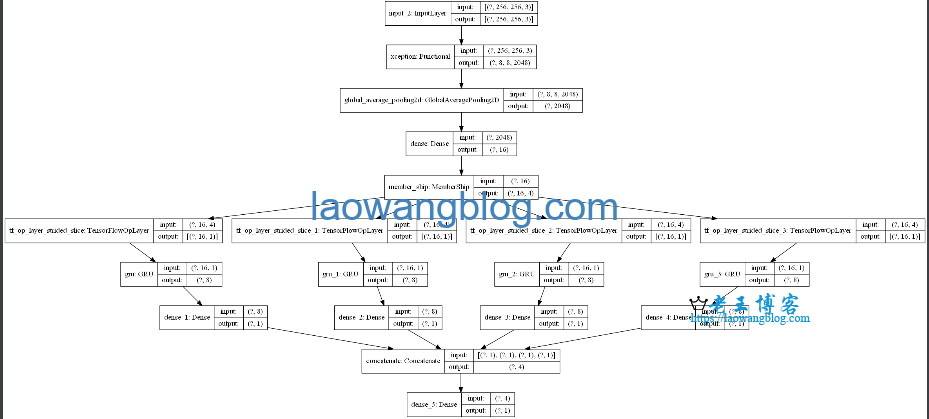
今天老王在使用 Keras plot_model 方法将模型结构可视化保存成图片时,报错 failed to import pydot. you must pip install pydot and install graphviz,安装了 pydot 和 graphviz 后还是报错,本文分享下解决方法。
一、Keras 模型可视化方法介绍
模型可视化用的是 plot_model 方法,方法如下:
tf.keras.utils.plot_model(
    model,
    to_file="model.png",
    show_shapes=False,
    show_dtype=False,
    show_layer_names=True,
    rankdir="TB",
    expand_nested=False,
    dpi=96,
    layer_range=None,
)
其中 to_file 就是保存的路径,其他可以默认,参数详细介绍:
- model: A Keras model instance
- to_file: File name of the plot image.
- show_shapes: whether to display shape information.
- show_dtype: whether to display layer dtypes.
- show_layer_names: whether to display layer names.
- rankdir:
rankdirargument passed to PyDot, a string specifying the format of the plot: ‘TB’ creates a vertical plot; ‘LR’ creates a horizontal plot. - expand_nested: Whether to expand nested models into clusters.
- dpi: Dots per inch.
- layer_range: input of
listcontaining twostritems, which is the starting layer name and ending layer name (both inclusive) indicating the range of layers for which the plot will be generated. It also accepts regex patterns instead of exact name. In such case, start predicate will be the first element it matches tolayer_range[0]and the end predicate will be the last element it matches tolayer_range[1]. By defaultNonewhich considers all layers of model. Note that you must pass range such that the resultant subgraph must be complete.
二、failed to import pydot 解决方法
在使用这个包时,报错 failed to import pydot. you must pip install pydot and install graphviz。
按照提示先安装 pydot:pip install pydot
再安装 graphviz,网上一些教程说还是在 pip 里安装,但其实应该是在电脑上安装,下载地址:https://graphviz.gitlab.io/download/
下载好后直接安装即可,选择将 graphviz 加入到 Path 路径中,如果没有勾选则自己修改系统变量,在 Path 中增加一条记录:D:\Program Files\Graphviz\bin (修改成自己的安装路径)。
之后,一定要重启 IDE 让它读取新的 Path,否则还是会报错,老王就是没重启 PyCharm,安装了还是报同样的错。
之后,就可以正常输出模型结构了:


